Theoretical construction of a generic wetness-line in the two-dimensional space defined by the Tasseled Cap components for soil brightness (x-axis) and surface wetness (y-axis).
Mapping global tropical wetlands
Thomas Gumbricht
Karttur AB
The maps below are published using OpenLayers. They are at an original resolution of 250 to 500 m spatial resolution. The coverage is the global tropics, extended to include the complete continents of Africa, South America and Australia. The maps were produced in an effort to map global tropical wetlands.
Stockholm 26 Aug 2013
Thomas Gumbricht
|
Map |
|
|
|
|
|
|
|
|
|
RTWI is a non-linear normalized difference index developed for mapping soil surface wetness. The index is created in three steps. The first step is the identification of spetral end-members, and must include light (dry) soil, dark (wet) soil, dense vegetation and water. In the second step the spectral end-embers are used to performed a Principal Component Analysis (PCA) rotating the image bands to represent the identified biophysical features. The third step is the definition of the index itself, using the biophysical components of soil brightness and surface wetness as X and Y axis.
Theoretical
construction of a generic wetness-line in the two-dimensional space
defined by the Tasseled Cap components for soil brightness (x-axis)
and surface wetness (y-axis).
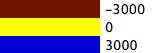
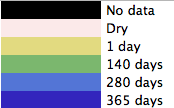
The RTWI index maps are created from annual time-series of MODIS reflectance data. For each year 23 images (representing 16 day intervals) were used for constructing the RTWI time-series. The phenology of the time-series was analyzed by first removing out-layers and then smoothing the wetness time-series using local regression. From the smoothed time-series the mean, standard deviation, maximum and minimum of the annual RTWI phenology was extracted. By setting thresholds, the duration of wetness conditions above (or below) a certain level can be extracted. The maps available online show the thresholds of RTWI = 0 (representing an average soil wetness condition) and RTWI = 1000 (representing soils saturated with water).
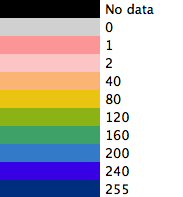
Legend for RTWI maps
Legend for RTWI duration maps
Runoff (Rrun) was derived by summing the positive differences between total rainfall (P) and reference evapotranspiration (ET) for each month (m):
![]() eqn
1
eqn
1
For cells with Rrunannual less than 20% of total precipitation, the runoff is adjusted up to a maximum of 20% of total precipitation:
 eqn
2
eqn
2
where
precip is the total annual precipitation
Etrest is the remaining evaporative power (from equation 1)
The cell runoff used for routing flow was then set to the maximum value of Rrun:
![]() eqn
3
eqn
3
The selection of 20% as a threshold was based on visually analyzing the transgression in runoff from wet to dry regions. The original runoff data generates crisp boundaries between wet and dry areas (e.g the boundary between the Congo rainforest and the Kalahari). Iteratively trying various thresholds, 20% was derived at as the lowest level at which the maps had a more smooth appearance, still retaining no-flow areas over dry regions.
Flow adjusted annual runoff from each cell was routed over the The Shuttle Radar Topography Mission (SRTM) Digital Elevation Model (DEM) using a Multiple Flow Direction (MFD) algorithm. As water accumulates downstream , an increasing fraction of the remaining evaporative power (Etrest) was used to reduce accumulated flow. At an upstream area of 400 km2 all the remaining evaporative power was allowed to reduce the runoff. At smaller upstream areas a fraction starting at 25% and adjusted for local slope was used to reduce runoff:
![]() eqn
3
eqn
3
The starting threshold of 25 % was set in order to re-adjust for the added runoff (eqn 2). The setting of the threshold 400 km2 to allow all the evaporative power to set in was done after comparing runoff results for dryland rivers in Southern and Eastern Africa.
The cell runoff from each cell was adjusted for the added evapotranspiration:
![]() eqn
4
eqn
4
The reduction in evaporative power are adjusted for the additional fraction actually evapotranspirated:
![]() eqn
5
eqn
5
Precipitation data was taken from worldclim, evapotranspiration from the FAO reference evapotranspiration.
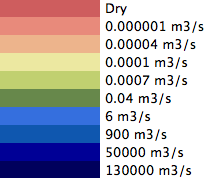
Legend for runoff map
CCTCI uses the runoff and local (cell) precipitation as input. The runoff is divided by the contour length of the pixel. Precipitation is assumed to contribute both to local (cell) ground water formation, and to in-flow or out-flow dependent on slope position. Concave surfaces looses ground water to its neighbors, convex surfaces gain ground-water, and planar surfaces do not exchange ground-water. The neighborhood for influence of precipitation is maximized to 3 km. The water input (surface flow and ground-water) is divided by the tangent of the slope multiplied by a curvature factor.
where:
Rrun is the upstream inflow of surface flow
b is the cell contour length
Grw is the ground-water inflow component
Inf is the cell water infiltration component
B is the local slope (minimum slope set to 0.25o)
Curvfac is the accumulate profile curvature over 1.5 km distance from the cell, rescaled to unity where the profile is flat.
The ground-water component (Grw) allows local precipitation and neighborhood topography to contribute towards local water inflow. It is a highly simplified approach, but needed in order to account for wetness in regions with very high rainfall (e.g. peat domes in South East Asia) and for wetting floodplains in drier areas. Over flat terrain there is no ground-water flow. Depressions can receive up to the amount of the local runoff from its 80 closest neighbors. Hilltops can loose up to 15 % of their local runoff. The transfer is calculated from the accumulated profile curvature at up to 1.5 km distance.
![]()
where
profc is the profile curvature (1/radius of slope curvature) for 250, 750 and 1500 m cell sizes. The sum of profc is confined to the range -0.15 to 1.
The cell infiltration component (inf) allows a fraction of the precipitation to add to the cell wetness:
![]()
Legend for CCTCI map
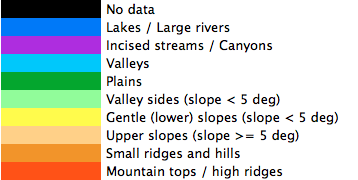
The landform map is based on the Topographic Position Index (TPI):
TPI = Zgrid – focalmean(Zgrid,cicle,r)
where Zgrid is the cell of the DEM. The focal mean is the mean DEM value within the circle of radius r centering on the cell.
By using TPI derived from two (or more) hierarchical scales, a fairly simple set of rules can be used for
By complementing the TPI data with data on upstream areas, profile curvatures and slopes, a more complex set of rules were created, allowing for a more generic landscape classification.
Legend for landform map